How to Calculate Allocation Error


Getting a handle on what’s driving stockouts is a challenge that most retailers struggle with. While there are many factors to consider in assessing inventory health, ultimately, stockouts result from two types of decisions:
- Buying decisions - not enough inventory was purchased to meet demand across all stores and channels.
- Allocation decisions - poor inventory allocation resulted in stockouts at some stores.
In this post, we are going explain how to calculate allocation error to assess the quality of your allocation decisions.
Curious why allocation error is so important for merchandising teams?
Read my post on the dangers of misleading allocation metrics.
Assessing Allocations
There are two data sources your need to analyze to understand inventory health: inventory position data and sales transaction data. From these you can calculate allocation error — Syrup’s industry-leading metric to assess the ROI of our inventory optimization algorithms.
Allocation error helps us isolate and quantify the impact of stockouts on your business.
How to Calculate Allocation Error
To quantify the impact of buying and allocation decisions, we calculate lost revenue.
- Lost revenue is the expected revenue that would have been generated based on a recent historical average, only applied in case there is a stockout.
Lost revenue is split between buying lost revenue and allocation lost revenue.
- Allocation lost revenue is the lost revenue because of an allocation stockout.
- Buying lost revenue is the lost revenue because of a buying stockout.
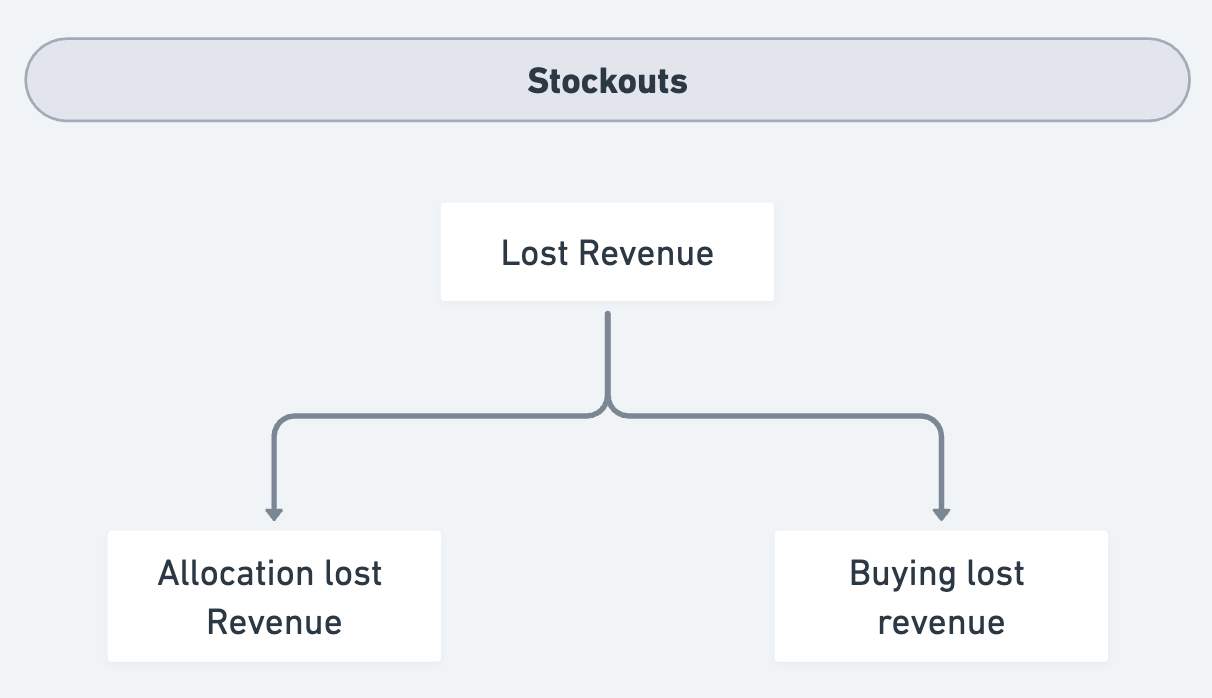
We combine allocation lost revenue and lost revenue to create Syrup’s industry leading ROI measure: allocation error.
.png)
💡 Allocation error measures the % of total demand that wasn’t captured because of improper allocations.
Total demand is your full revenue potential — the revenue you generated combined with lost revenue from allocation and buying errors.
Example Scenario Showing Allocation Error's Impact on Stockouts
Consider the scenario described in the table below, with the following assumptions for simplicity:
- Units take 1 day to move between a distribution center and a store
- Lost sales are calculated using the previous day’s sales (the most recent day that had inventory)
- The product costs $5
- Allocation stockouts are identified by 🚨
- Buying stockouts are identified by 🛒
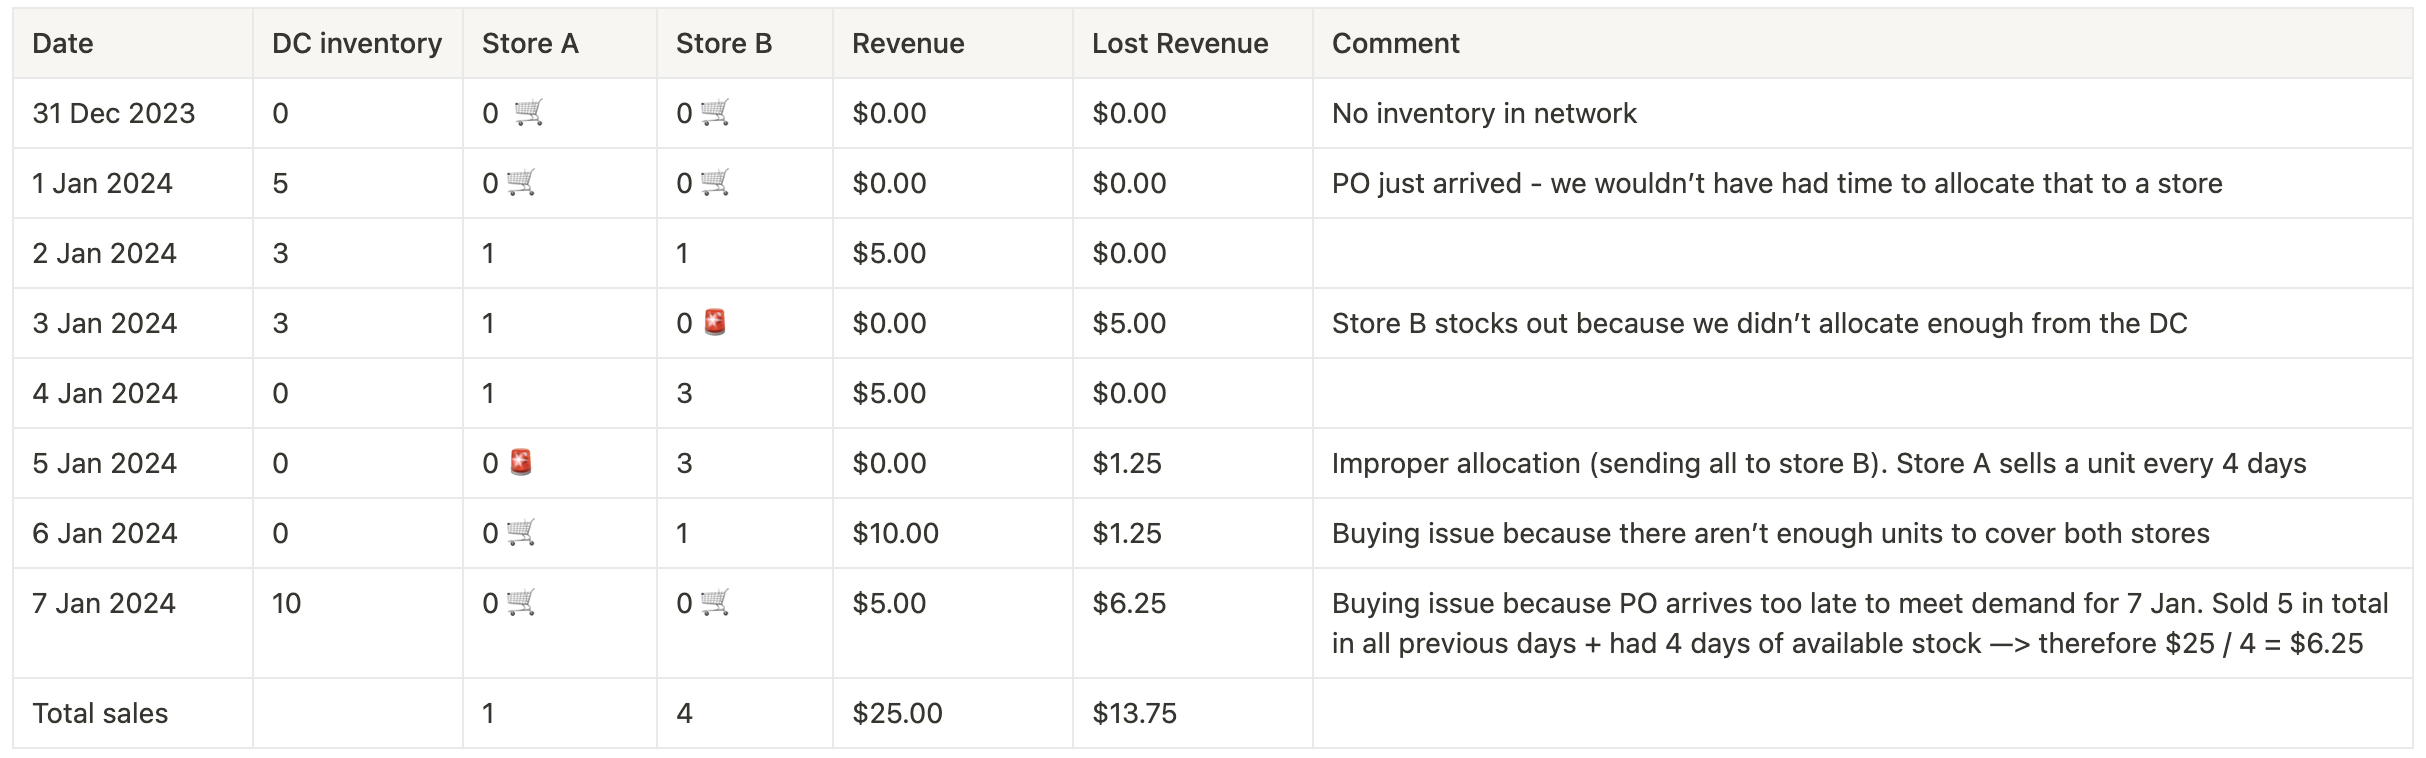
Over the 7 days:
- We generated a total revenue of $25
- There were two allocation stockouts
- Resulting in $6.25 of lost revenue
- There were two buying stockouts
- Resulting in $7.50 of lost revenue
- In total we lost $13.75 of revenue
- Allocation error is
- Allocation stockouts / total missed demand
- = $6.25 / ( $25 + $13.75 ) = 16%
- Allocation stockouts / total missed demand
I hope this walkthrough has been helpful! Don't hesitate to reach out if you're interested in learning more analytics tricks.
Check out our Allocations product to see how you can build on your understanding of allocation error with action in the moment.
Watch the On-Demand Recording
Recommended resources
See all resources
.png)
.png)
Make Forecasting Your
Superpower
See how AI tailored to your unique business can deliver
insights that boost margin.